
📘 Book Progress: ■□□□□□□□□□ 5% Complete
Level 1 - Book 2 - Chapter 3
Support & Resistance
Edition 1.0
Published by: SmartTraderSelect Academy Last Updated
August 2026
Support & Resistance
Understanding the Key Price Levels Traders Watch
Support and resistance are fundamental concepts in technical analysis. They help traders identify areas where buying or selling pressure may increase and where price may react.
Understanding these levels provides an important foundation for analyzing charts, planning trades, and developing rule-based trading strategies.
⬅ Chapter 2
➡ Chapter 4
What Is Support?
Support is a price area where buying interest has historically been strong enough to slow or stop a decline.
When price approaches a support area, buyers may become more active while sellers may become less aggressive.
For example, if Gold repeatedly finds buyers around a particular price area, traders may consider that area a potential support zone.
However, support is not a guaranteed floor. Price can break through it when selling pressure becomes strong enough.
What Is Resistance?
Resistance is a price area where selling pressure has historically been strong enough to slow or stop a rise.
When price approaches resistance, sellers may become more active while buyers may become less aggressive.
Like support, resistance is not a permanent ceiling. Strong buying pressure can eventually push price above it.
Support vs Resistance
| Support | Resistance |
|---|---|
| Located below current price | Located above current price |
| Buyers may become more active | Sellers may become more active |
| Can slow a decline | Can slow an advance |
| May eventually break | May eventually break |
How Support and Resistance Form
Support and resistance can develop from several factors.
Previous Highs and Lows
Previous swing highs and lows can become important reference points.
Psychological Price Levels
Round numbers such as:
- 1.1000 on EUR/USD
- 150.00 on USD/JPY
- 3,000 on Gold
may attract attention from traders.
Repeated Price Reactions
If price repeatedly reacts around the same area, traders may consider that zone significant.
Trend Lines
Trend lines can sometimes act as dynamic support or resistance as price moves through time.

Support and Resistance Are Zones
One important concept is that support and resistance should not always be treated as a single exact price.
Markets are made up of many participants placing orders at different prices.
Therefore, a better approach is often to identify a zone where price has previously reacted.
For example:
Support Zone: 3,300–3,320
rather than assuming exactly:
Support: 3,310
This provides a more realistic view of market behaviour.
When Support Becomes Resistance
One of the most useful concepts in technical analysis is the role reversal between support and resistance.
Suppose price repeatedly holds above a resistance area and eventually breaks through it.
After the breakout, that previous resistance may become a new support area.
Similarly, when price breaks below support, that previous support may later act as resistance.
Simple Example
Resistance
────────
↑
│ Breakout
│
────────
New Support
This concept is commonly used when analyzing breakouts and pullbacks.
Breakouts
A breakout occurs when price moves beyond an established support or resistance area.
For example:
Resistance → Price breaks above → Potential bullish continuation
or:
Support → Price breaks below → Potential bearish continuation
However, not every breakout is genuine.
False Breakouts
Sometimes price temporarily moves beyond a level before returning inside the previous range.
This is known as a false breakout or fakeout.
For example:
- Price approaches resistance.
- Price moves above resistance.
- Buyers fail to maintain momentum.
- Price falls back below resistance.
This is why traders often wait for confirmation instead of entering immediately when price briefly crosses a level.
Using Support & Resistance in a Trading Plan
Support and resistance can help traders structure a trading plan.
Before entering a trade, consider:
1. Where is the current price?
Determine whether price is closer to support or resistance.
2. What is the overall trend?
A support level in an uptrend may have a different meaning from support in a strong downtrend.
3. Is price approaching an important level?
Major levels may influence where traders look for potential entries or exits.
4. Where would the trade idea be invalidated?
A trading plan should define the conditions under which the original idea is no longer valid.
5. Is the potential reward worth the risk?
Support and resistance can help identify logical areas for planning potential risk and reward.
Practical Example: Gold
Imagine Gold is trending upward and repeatedly finds buying interest around a support zone.
A trader might observe:
Resistance: 3,400
Current Price: 3,350
Support: 3,300–3,320
Instead of automatically buying simply because price reaches support, the trader may wait for evidence that buyers are returning.
Possible confirmation could include:
- A bullish candlestick formation
- Strong rejection of the support zone
- A change in short-term market structure
- Confirmation from another technical tool
The important point is that support provides context, not a guaranteed entry signal.
Common Beginner Mistakes
❌ Treating support and resistance as exact prices.
❌ Assuming a level can never break.
❌ Entering immediately whenever price touches support.
❌ Ignoring the overall trend.
❌ Using too many levels on one chart.
❌ Assuming every breakout will continue.
A clean chart with a few meaningful levels is often easier to analyze than a chart filled with lines.
Key Takeaways
✔ Support is an area where buying interest may slow a decline.
✔ Resistance is an area where selling pressure may slow an advance.
✔ Support and resistance are better viewed as zones rather than exact prices.
✔ Previous highs, lows, psychological levels, and trend lines can create important areas.
✔ Support can become resistance, and resistance can become support.
✔ Breakouts can be genuine or false.
✔ These levels help traders structure decisions but do not guarantee market reactions.
Frequently Asked Questions
Is support always below the current price?
Normally, yes. Support represents an area below current price where buying interest may appear. However, once price breaks through a support level, that area may later become resistance.
Is resistance always above the current price?
Normally, yes. Resistance represents an area above current price where selling pressure may appear. A strong breakout can cause the previous resistance to become support.
How many support and resistance levels should I use?
There is no fixed number. Focus on the levels that have demonstrated meaningful price reactions rather than marking every small movement on the chart.
Can support and resistance predict price direction?
No. They identify areas where price may react. Traders should use additional market context and risk management rather than assuming a reaction is guaranteed.
Can Expert Advisors use support and resistance?
Yes. Automated systems can be programmed to identify previous highs and lows, price zones, breakouts, and other predefined levels. The exact rules depend on the strategy.
Automation Insight
Support and resistance can be converted into objective rules for automated trading systems.
For example, an Expert Advisor could be programmed to identify recent swing highs and lows, detect when price approaches a predefined zone, and then wait for specific confirmation before considering a trade.
The important part is that the rules must be clearly defined. A human trader may say, “This looks like strong resistance,” while an automated system needs measurable conditions such as a specific price range, number of previous reactions, or breakout distance.
Related Chapters
Continue your learning with:
- Chapter 1 – Introduction to Technical Analysis
- Chapter 2 – Candlestick Charts
- Chapter 3 – Support & Resistance
- Chapter 4 – Trend Lines
- Chapter 5 – Chart Patterns
- Chapter 6 – Moving Averages
- Chapter 7 – Relative Strength Index (RSI)
- Chapter 8 – Moving Average Convergence Divergence (MACD)
- Chapter 9 – Fibonacci Retracement
- Chapter 10 – Combining Technical Indicators
- Book 1 – Forex Fundamentals Overview
Ready to Read Price Charts?
Now that you understand the purpose of technical analysis, it’s time to learn the language of the market: candlestick charts.
In the next chapter, you’ll discover how candlesticks reveal buying and selling pressure, market sentiment, and potential trend reversals.
Internal Links
Support & Resistance
Understanding the Key Price Levels Traders Watch
Support and resistance are fundamental concepts in technical analysis. They help traders identify areas where buying or selling pressure may increase and where price may react.
Understanding these levels provides an important foundation for analyzing charts, planning trades, and developing rule-based trading strategies.
⬅ Chapter 2
➡ Chapter 4
What Is Support?
Support is a price area where buying interest has historically been strong enough to slow or stop a decline.
When price approaches a support area, buyers may become more active while sellers may become less aggressive.
For example, if Gold repeatedly finds buyers around a particular price area, traders may consider that area a potential support zone.
However, support is not a guaranteed floor. Price can break through it when selling pressure becomes strong enough.
What Is Resistance?
Resistance is a price area where selling pressure has historically been strong enough to slow or stop a rise.
When price approaches resistance, sellers may become more active while buyers may become less aggressive.
Like support, resistance is not a permanent ceiling. Strong buying pressure can eventually push price above it.
Support vs Resistance
| Support | Resistance |
|---|---|
| Located below current price | Located above current price |
| Buyers may become more active | Sellers may become more active |
| Can slow a decline | Can slow an advance |
| May eventually break | May eventually break |
How Support and Resistance Form
Support and resistance can develop from several factors.
Previous Highs and Lows
Previous swing highs and lows can become important reference points.
Psychological Price Levels
Round numbers such as:
- 1.1000 on EUR/USD
- 150.00 on USD/JPY
- 3,000 on Gold
may attract attention from traders.
Repeated Price Reactions
If price repeatedly reacts around the same area, traders may consider that zone significant.
Trend Lines
Trend lines can sometimes act as dynamic support or resistance as price moves through time.
Support and Resistance Are Zones
One important concept is that support and resistance should not always be treated as a single exact price.
Markets are made up of many participants placing orders at different prices.
Therefore, a better approach is often to identify a zone where price has previously reacted.
For example:
Support Zone: 3,300–3,320
rather than assuming exactly:
Support: 3,310
This provides a more realistic view of market behaviour.
When Support Becomes Resistance
One of the most useful concepts in technical analysis is the role reversal between support and resistance.
Suppose price repeatedly holds above a resistance area and eventually breaks through it.
After the breakout, that previous resistance may become a new support area.
Similarly, when price breaks below support, that previous support may later act as resistance.
Simple Example
Resistance
────────
↑
│ Breakout
│
────────
New Support
This concept is commonly used when analyzing breakouts and pullbacks.
Breakouts
A breakout occurs when price moves beyond an established support or resistance area.
For example:
Resistance → Price breaks above → Potential bullish continuation
or:
Support → Price breaks below → Potential bearish continuation
However, not every breakout is genuine.
False Breakouts
Sometimes price temporarily moves beyond a level before returning inside the previous range.
This is known as a false breakout or fakeout.
For example:
- Price approaches resistance.
- Price moves above resistance.
- Buyers fail to maintain momentum.
- Price falls back below resistance.
This is why traders often wait for confirmation instead of entering immediately when price briefly crosses a level.
Using Support & Resistance in a Trading Plan
Support and resistance can help traders structure a trading plan.
Before entering a trade, consider:
1. Where is the current price?
Determine whether price is closer to support or resistance.
2. What is the overall trend?
A support level in an uptrend may have a different meaning from support in a strong downtrend.
3. Is price approaching an important level?
Major levels may influence where traders look for potential entries or exits.
4. Where would the trade idea be invalidated?
A trading plan should define the conditions under which the original idea is no longer valid.
5. Is the potential reward worth the risk?
Support and resistance can help identify logical areas for planning potential risk and reward.
Using Support & Resistance in a Trading Plan
Key Takeaways
✔ Candlestick charts display OHLC prices.
✔ Every candlestick represents one trading period.
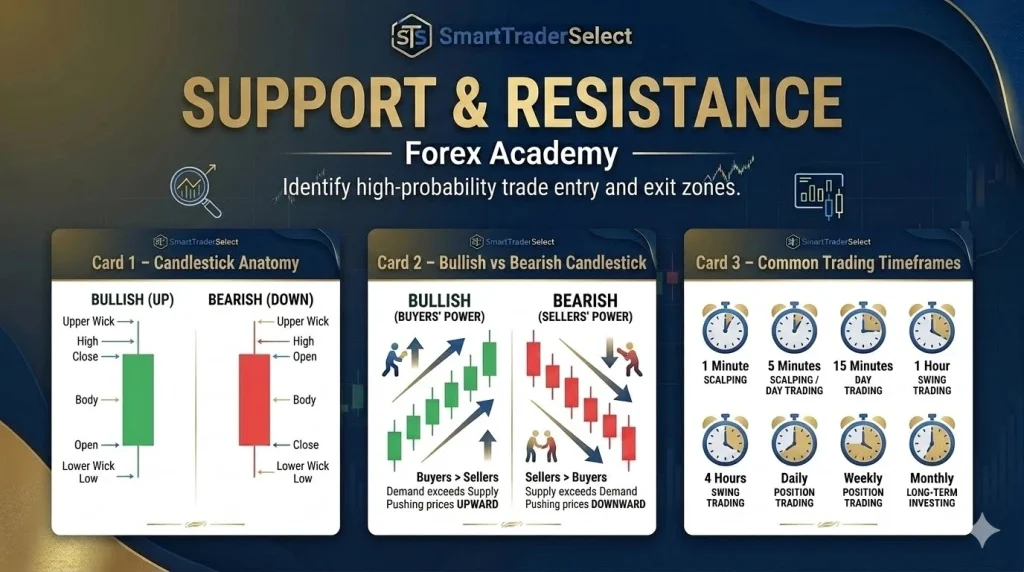
✔ Bullish candles close above the opening price.
✔ Bearish candles close below the opening price.
✔ Bodies and wicks reveal buying and selling activity.
✔ Candlestick charts help traders understand market behaviour.
Frequently Asked Questions
Why are candlestick charts more popular than line charts?
Candlestick charts display more information by showing the opening, closing, highest, and lowest prices, making it easier to understand market behaviour.
Can one candlestick predict the next market move?
No. A single candlestick should be interpreted within the broader market context. Traders often look at multiple candlesticks together rather than relying on one candle alone.
Which timeframe is best for beginners?
Many beginners start with the 1-Hour or 4-Hour charts because they generally contain less market noise than very short timeframes.
Do automated trading systems use candlestick data?
Yes. Many Expert Advisors analyze candlestick data, including opening, closing, high, and low prices, to determine when trading conditions meet predefined rules.
Automation Insight
Technical analysis is the language that many automated trading systems use to interpret the market. An Expert Advisor cannot “see” a chart like a human trader—it follows predefined rules such as moving average crossovers, RSI thresholds, breakout levels, or trend filters. Understanding these concepts manually will make it much easier to evaluate, build, or improve automated trading strategies in the future.
Related Chapters
Continue your learning with:
- Chapter 1 – Introduction to Technical Analysis
- Chapter 2 – Candlestick Charts
- Chapter 3 – Support & Resistance
- Chapter 4 – Trend Lines
- Chapter 5 – Chart Patterns
- Chapter 6 – Moving Averages
- Chapter 7 – Relative Strength Index (RSI)
- Chapter 8 – Moving Average Convergence Divergence (MACD)
- Chapter 9 – Fibonacci Retracement
- Chapter 10 – Combining Technical Indicators
- Book 1 – Forex Fundamentals Overview
Ready to Read Price Charts?
Now that you understand the purpose of technical analysis, it’s time to learn the language of the market: candlestick charts.
In the next chapter, you’ll discover how candlesticks reveal buying and selling pressure, market sentiment, and potential trend reversals.
➡️Continue to Book 2 – Chapter 3: Support and Resistance