
📘 Book Progress: ■□□□□□□□□□ 5% Complete
Level 1 - Book 2 - Chapter 2
Candlestick Charts
Edition 1.0
Published by: SmartTraderSelect Academy Last Updated
August 2026
Candlestick Charts
Understanding the Language of Price
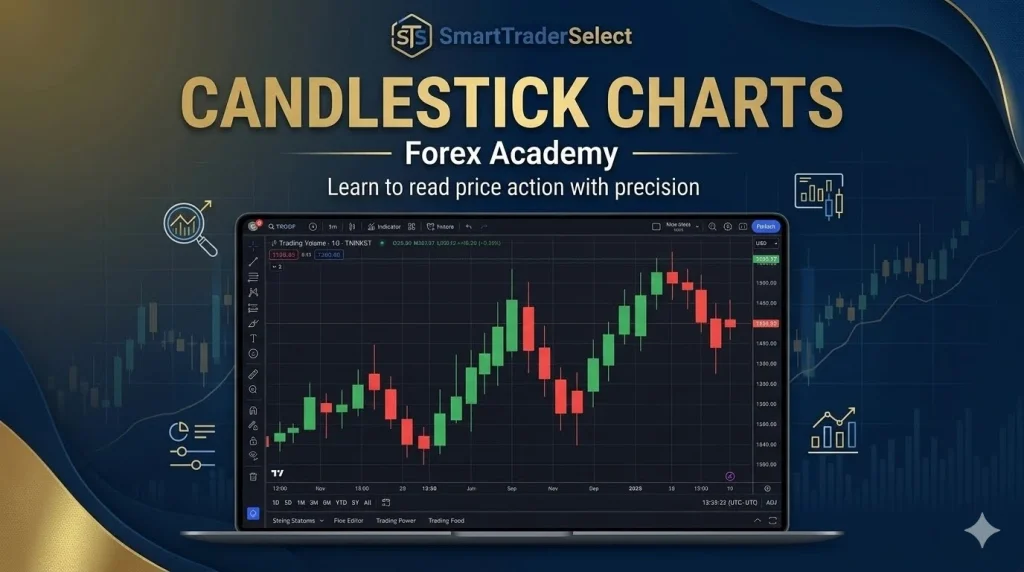
Candlestick charts are one of the most popular chart types used by Forex traders around the world. Each candlestick tells a story about the battle between buyers and sellers during a specific period of time.
Learning to read candlestick charts is one of the first steps toward understanding market sentiment and identifying potential trading opportunities.
“Every candlestick represents a snapshot of market psychology.”
➡ Next Chapter
What Are Candlestick Charts?
A candlestick chart displays the opening, closing, highest, and lowest prices during a selected time period.
Unlike a simple line chart, candlesticks provide more information about price movement and market sentiment.
Each candlestick represents one trading period, such as:
- 1 Minute
- 5 Minutes
- 15 Minutes
- 1 Hour
- 4 Hours
- Daily
- Weekly
- Monthly
The timeframe determines how much market activity each candlestick represents.
Anatomy of a Candlestick
Every candlestick contains four important prices:
Open
The price where the trading period began.
High
The highest price reached during the period.
Low
The lowest price reached during the period.
Close
The final price when the period ended.
These four prices are commonly referred to as OHLC (Open, High, Low, Close).
Bullish and Bearish Candlesticks
Bullish Candlestick
A bullish candlestick forms when the closing price is higher than the opening price.
It indicates that buyers were stronger than sellers during that period.
Bearish Candlestick
A bearish candlestick forms when the closing price is lower than the opening price.
It indicates that sellers were stronger than buyers during that period.
The Candlestick Body and Wicks
Each candlestick has two main parts:
Body
The body shows the difference between the opening and closing prices.
A larger body often suggests stronger buying or selling pressure.
Upper Wick
The upper wick represents the highest price reached before the market moved lower.
Lower Wick
The lower wick represents the lowest price reached before the market moved higher.
Long wicks often indicate that price was rejected from those levels.
What Candlesticks Tell Us
Candlesticks help traders understand:
- Market sentiment
- Buying pressure
- Selling pressure
- Price rejection
- Momentum
- Volatility
Instead of predicting the future, candlesticks provide clues about how buyers and sellers behaved during each trading period.

Example
Imagine a one-hour Gold (XAU/USD) candlestick:
- Open: 3,350
- High: 3,365
- Low: 3,345
- Close: 3,360
Because the closing price is above the opening price, the candle is bullish.
The long upper wick shows that buyers pushed prices higher before some selling pressure appeared.
Choosing the Right Timeframe
Different traders use different chart timeframes.
| Timeframe | Common Use |
|---|---|
| 1–5 Minutes | Scalping |
| 15–30 Minutes | Intraday Trading |
| 1 Hour | Day Trading |
| 4 Hours | Swing Trading |
| Daily | Position Trading |
| Weekly | Long-term Analysis |
There is no single “best” timeframe. It depends on your trading style and strategy.
Key Takeaways
✔ Candlestick charts display OHLC prices.
✔ Every candlestick represents one trading period.
✔ Bullish candles close above the opening price.
✔ Bearish candles close below the opening price.
✔ Bodies and wicks reveal buying and selling activity.
✔ Candlestick charts help traders understand market behaviour.
Frequently Asked Questions
Why are candlestick charts more popular than line charts?
Candlestick charts display more information by showing the opening, closing, highest, and lowest prices, making it easier to understand market behaviour.
Can one candlestick predict the next market move?
No. A single candlestick should be interpreted within the broader market context. Traders often look at multiple candlesticks together rather than relying on one candle alone.
Which timeframe is best for beginners?
Many beginners start with the 1-Hour or 4-Hour charts because they generally contain less market noise than very short timeframes.
Do automated trading systems use candlestick data?
Yes. Many Expert Advisors analyze candlestick data, including opening, closing, high, and low prices, to determine when trading conditions meet predefined rules.
Automation Insight
Technical analysis is the language that many automated trading systems use to interpret the market. An Expert Advisor cannot “see” a chart like a human trader—it follows predefined rules such as moving average crossovers, RSI thresholds, breakout levels, or trend filters. Understanding these concepts manually will make it much easier to evaluate, build, or improve automated trading strategies in the future.
Related Chapters
Continue your learning with:
- Chapter 1 – Introduction to Technical Analysis
- Chapter 2 – Candlestick Charts
- Chapter 3 – Support & Resistance
- Chapter 4 – Trend Lines
- Chapter 5 – Chart Patterns
- Chapter 6 – Moving Averages
- Chapter 7 – Relative Strength Index (RSI)
- Chapter 8 – Moving Average Convergence Divergence (MACD)
- Chapter 9 – Fibonacci Retracement
- Chapter 10 – Combining Technical Indicators
- Book 1 – Forex Fundamentals Overview
Ready to Read Price Charts?
Now that you understand the purpose of technical analysis, it’s time to learn the language of the market: candlestick charts.
In the next chapter, you’ll discover how candlesticks reveal buying and selling pressure, market sentiment, and potential trend reversals.
➡️Continue to Book 2 – Chapter 3: Support and Resistance