
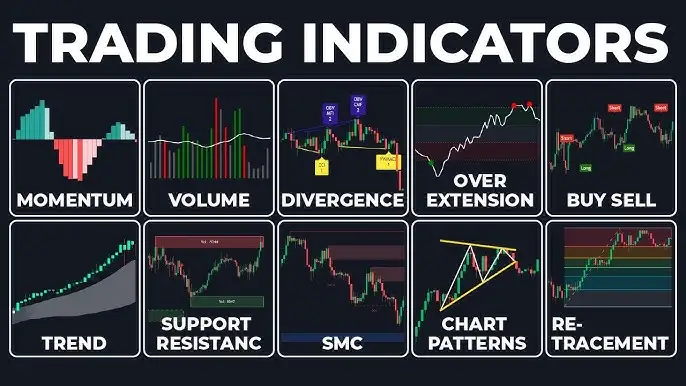

A beginner-friendly guide to the most widely used forex indicators — RSI, MACD, and moving averages — and how traders use them.
Open any trading platform and you’ll find dozens of indicators available at a click. For a beginner, this can feel overwhelming. The good news: a small handful of well-understood indicators form the backbone of most trading strategies, automated or manual. This guide covers the three most widely used — moving averages, RSI, and MACD — in plain language.
What Is a Technical Indicator, Really?
A technical indicator is simply a mathematical calculation applied to price (and sometimes volume) data, displayed visually on your chart. Instead of trying to interpret raw, noisy price movement by eye, an indicator processes that data into a clearer, more structured signal — trend direction, momentum, potential turning points, and so on.
Indicators don’t predict the future. They describe what has already happened in a structured way, which traders then use to inform decisions about what might happen next.
Moving Averages (MA / EMA)
A moving average smooths out price over a defined number of periods (e.g., 20, 50, 200) to reveal the underlying trend direction, filtering out short-term noise.
- Simple Moving Average (SMA) — the average price over the last X periods, weighted equally.
- Exponential Moving Average (EMA) — similar, but gives more weight to recent price data, making it more responsive to new price action.
How traders use it: A common approach is watching for “crossovers” — for example, when a shorter-term EMA crosses above a longer-term EMA, it’s often interpreted as a potential shift toward an uptrend, and vice versa for a downtrend. Moving averages are also frequently used as dynamic support/resistance levels.
Limitation: Because moving averages are based on past price, they lag current price action — they’re better at confirming an established trend than predicting a new one before it starts.
RSI (Relative Strength Index)
RSI is a momentum oscillator that measures the speed and magnitude of recent price movements, displayed on a scale from 0 to 100.
How traders use it: Readings above 70 are traditionally considered “overbought” (price may have risen too far, too fast), while readings below 30 are considered “oversold” (price may have fallen too far, too fast). Some traders use these levels to anticipate potential reversals or pullbacks; others use RSI divergence (when price makes a new high/low but RSI doesn’t confirm it) as an early warning sign of weakening momentum.
Limitation: During a strong trend, RSI can remain in “overbought” or “oversold” territory for extended periods without a reversal — treating those levels as automatic buy/sell signals, on their own, is a common beginner mistake.
MACD (Moving Average Convergence Divergence)
MACD tracks the relationship between two exponential moving averages (typically 12-period and 26-period), plotted alongside a “signal line” (usually a 9-period EMA of the MACD line itself).
How traders use it: When the MACD line crosses above the signal line, it’s often read as bullish momentum building; a cross below is often read as bearish momentum building. The histogram (the visual bars between the MACD and signal lines) helps visualize the strength of that momentum shift.
Limitation: Like moving averages, MACD is a lagging indicator — it’s built from moving averages, so it confirms momentum shifts after they’ve begun rather than predicting them in advance.
Why No Single Indicator Is Enough on Its Own
Each of these tools answers a different question: moving averages address trend direction, RSI addresses momentum extremes, and MACD addresses momentum shifts. Relying on just one in isolation tends to produce inconsistent results — most well-built strategies (manual or automated) combine two or three complementary indicators to filter out lower-quality signals and confirm higher-quality ones.
This is exactly why automated indicators and signal systems exist: rather than manually cross-referencing multiple indicators in real time — which is slow and prone to interpretation bias — a coded signal system can apply the same multi-indicator logic instantly and consistently, every time.
Try Data-Driven Signals for Yourself
If you’d like to see how a rules-based signal system applies indicator logic in practice, our free Starter Automation Toolkit includes a beginner-friendly signal indicator you can add directly to your own chart.
[Explore Copy Trading →] · [Explore EA Trading →]· [Beginner to Professional Automated Trader Masterclass →]
This article is for educational purposes only and does not constitute financial advice.